Owning a clean, debris-free pool surface (leaves, dust, pollen) is one of the trickiest maintenance tasks. Modern automatic pool surface skimmers promise to handle that job for you — but how well do they actually perform? In this post I walk you through a rigorous testing protocol for current market units, highlight the crucial performance factors to monitor, and show how to present comparative results in a clear, convincing way.
Goals & Overall Approach
Before diving into execution, it’s helpful to clarify what we want from a test of pool surface cleaners. The high-level goals:
- Cleaning effectiveness — how completely and reliably does the robot remove floating debris across different conditions?
- Coverage and consistency — does it reach corners and edges? Does it avoid “blind spots”?
- Cycle time and throughput — how fast (or slow) is it, per area cleaned?
- Energy / power draw — how much electricity or battery life is consumed per square meter (or square foot) cleaned?
- Reliability & robustness — does it get stuck, trip on obstacles, or lose suction?
- Ease of use & maintenance — how easy it is to set up, empty debris baskets, adjust settings, recover from faults, etc.
- Behavior in challenging conditions — e.g. heavy debris load, wind, waves, corners, corners near skimmer or drains.
Because there is no universally accepted standard for testing pool surface cleaners, our methodology draws inspiration from a past academic/industry report for pool cleaner performance testing (for floor/wall robots) which introduced the concept of energy factor as watt-hours per cleaned floor area. Swimming Pool Expert We adapted that into our surface focus context.
Test Setup & Equipment
Controlled pool testbed
We use a dedicated test pool (or large water tank simulating a pool) with controlled conditions:
- Dimensions known (e.g. 10 m × 5 m rectangle, ~50 m² surface).
- Calm water (no external currents or strong wind).
- Minimal waves (pool pump running, but not strong turbulence).
- Uniform ambient lighting to help video observation.
- Markers (such as grid lines or floating buoys) to help with positional tracking.
Debris materials
We prepare standard test debris, representing typical floating materials:
- Leaf litter (dry leaves of known size, e.g. 3–7 cm diameter)
- Fine dust / pollen (powder or dust mix)
- Light sticks or twigs
- Mixed small particles (e.g. bits of plastic, small leaf fragments)
- In some tests: floating films (e.g. light oil / film) or microplastics (if sensor capable)
We standardize total debris mass / count per test. For example, distribute 200 leaves + 100 g dust + 10 twigs uniformly across surface.
Power / instrumentation
- Power meter or energy log (if robot plugs into an AC supply).
- If battery-powered, a data logger or coulomb meter.
- Timer / stopwatch.
- Depth/tilt sensors (if useful) to ensure robot stays on surface.
- Video / overhead camera, for visual recording of coverage and missed zones.
- Possibly a grid of reference points on surface or remotely tracked path (GPS-like or camera-based) to map its trajectory.
Preconditioning & calibration
- Before each test run, clear the pool surface manually, ensure water is clean.
- Warm up the robot (if required by user manual).
- Adjust trimming / height / flotation settings per manufacturer instructions.
- Calibrate the power meter and ensure baseline idle draw is zeroed (i.e. measure baseline instrumentation consumption).
Testing Workflow: Step by Step
Here is a typical sequence for one test configuration (one debris type mix, one robot):
- Debris seeding
Distribute the standard debris mixture evenly across the pool surface. Let it settle for a few minutes so that floating dispersal is uniform. - Baseline snapshot
Take overhead photos/video showing initial debris positions. Optionally mark debris that will be hard to remove (corner piles, near edges, near drains). - Start run
Start the robot at a defined “start point” (e.g. center or one end). Start the timer and the energy logging simultaneously. - Run until termination
Let the robot run its programmed cycle (or until debris is cleared or no further progress). If it gets stuck or stuck in loops, pause the test and note the fault time. If robot includes an “auto stop when done” feature, let it self-terminate. Otherwise, run a fixed maximum time (e.g. 60 minutes) and stop. - Post-run cleanup
After stopping, capture video and overhead photos of remaining debris distribution. Using a gentle skimmer or net, retrieve any debris fragments for counting; mark which ones remain. - Clean-up reset
Empty the robot’s debris basket; flush it. Re-set the pool to initial state (remove leftover debris, possibly remix residual dust). Let water settle again. Then proceed next run (e.g. new debris type, new robot, or repeat replicate run). - Replicate runs
To ensure statistical robustness, repeat each condition at least 3 runs. Compute averages, standard deviations. - Variation tests
- Edge / corner seeding: place debris near edges, corners, close to walls.
- High debris density: double the standard load.
- Disturbance test: after some time, add a new debris cluster to see if the robot revisits that zone.
- Wind / wave simulation (if possible).
- Battery exhaustion test (let robot run until battery near empty).
- Intentional obstacle test (floating obstacle or small barrier) to see avoidance or fault behavior.
Key Performance Metrics & Focus Areas
Below is a list of performance metrics and what to look out for:
| Metric | Definition / Formula | Why It Matters | Notes / Caveats |
|---|---|---|---|
| Debris removal rate | (Mass or count of debris removed) ÷ (time) | Core metric: how fast the robot actually removes stuff | Use same units; consider outliers or very hard debris separately |
| Cleaning coverage ratio | (Area swept / total area) or (debris locations within path / total) | Shows how thoroughly it scans the entire surface | May miss corners or edges; compare path logs with misses |
| Miss rate | (Mass or count of left debris) ÷ (initial debris) | How much is left uncollected | Useful for comparative ranking |
| Cycle time per area | (Run time) ÷ (effective area cleaned) | Efficiency metric (s / m² or min / ft²) | Effective area is tricky — may discount repeated passes |
| Energy factor (efficiency) | (Energy consumed in Wh) ÷ (area cleaned in m²) | Key for judging power efficiency | Adapted from pool robot tests concept Swimming Pool Expert |
| Power draw (W) | Instantaneous wattage, average wattage | For understanding power peaks and sustained draw | Spikes may stress circuits |
| Coverage uniformity / path efficiency | Measure of overlapping passes, redundant coverage, or wasted movement | A robot that zig-zags inefficiently may waste time | Use video / trajectory log / path analysis |
| Edge & corner performance | Percent of debris removed near edges / corners relative to other zones | Critical for real-pool usability | Many robots struggle in tight boundary zones |
| Obstacle behavior / fault count | Number of times it got stuck, had to reverse, triggered collisions | Real-world robustness indicator | Reset time, ease of recovery matter too |
| Debris basket capacity & clogging | How much debris can the basket hold, and how often does clogging reduce performance? | User-centric metric: how often you must empty the filter | Also note how easy it is to empty / clean |
| Ease of use & user experience | Setup time, user interface, filter cleaning, fault recovery, maintenance | A good machine must serve humans too | Record hands-on steps, subjective scores |
| Reliability over multiple cycles | After many runs, does performance degrade? Are there failures induced by wear? | Longevity matters | Keep logs across runs, monitor for drift |
Focus areas / pitfalls to watch:
- Robots may tend to avoid or leave spots near walls or in corners.
- Some may cluster around a particular route (‘pet path’) rather than scanning broadly.
- Battery-backed units may slow down near end of battery, so performance is not uniform across the entire run.
- Repeated passes over same area inflate “area cleaned” metrics — need to discount redundancy.
- Water surface disturbances or small waves can push debris away; test in calm conditions.
- Some units might use “parking” behavior (when battery low, it parks near wall) — that should be considered in cycle termination logic.
- Ambient temperature and battery temperature can affect performance — log environment.
How to Present Results & Performance Showcase
Once you have all the raw metrics, the goal is to present them in a way that is meaningful to readers (pool owners, engineers, hobbyists). Here’s a suggested structure.
1. Summary Comparison Table
At the top, present a comparison table of the machines tested, listing:
- Model name
- Robot type (cordless, tethered, suction, etc.)
- Tested area (m²)
- Average removal rate (g/min or pieces/min)
- Miss rate (%)
- Cycle time per area (min / m²)
- Energy factor (Wh / m²)
- Fault count / failures
- User rating (ease of use, basket handling, setup)
This snapshot lets readers see “who wins overall” at a glance.
2. Performance Graphs
- Removal vs. time curves: plot cumulative debris removed (or remaining) vs. time for each robot.
- Power draw (W) over time: overlay power vs. time, or histogram of power usage.
- Efficiency vs. coverage: plot energy factor per robot, or normalized to area cleaned.
- Coverage heatmaps: using overhead mapping, show which zones were visited, which were missed, which were overpassed.
- Fault / event timelines: annotate when the robot got stuck, reversed, etc.
3. Spotlight Behavior/Scenarios
Include mini-sections showing:
- Corner challenge: before/after shots of debris near edges.
- Obstacle avoidance: sample video frames or photos showing how the robot handled a barrier.
- Battery depletion behavior: show how it slows (if at all) near battery end.
- High debris load behavior: how the robot handles saturation or clogging mid-run.
4. Qualitative Impressions & Ease of Use
Beyond numbers, readers care how easy or painful a device is:
- Setup: how many steps to launch it? Did it require calibration or fine adjustments?
- Basket / filter servicing: how easy to open, clean, reinsert?
- Fault recovery: if stuck, how easy to rescue?
- Noise, vibration, handling, weight, portability.
- Realistic expectations: e.g. “It handled large leaves well, but dust-level performance is less robust.”
5. Recommendations & Use Cases
Based on results, articulate:
- Which model is best for small pools, which for large ones.
- Which is best in dusty vs leaf-heavy environments.
- Whether it’s suited to above-ground vs in-ground pools, or saltwater vs fresh.
- Trade-offs (speed vs thoroughness, battery vs tethered, cost vs performance).
- Suggestions for consumer considerations (e.g. choose one with larger basket if many leaves fall; one that handles corners well; one that has robust recovery from faults).
6. Caveats & Limitations
Be transparent about test constraints:
- Tests done in calm, ideal conditions — real pools may have wind, currents, waves.
- Debris types are standardized — real-world mix may differ.
- Battery aging, long-term wear, UV exposure, chemicals in pool water might degrade performance over time.
- This is a “surface debris” test; robots that also vacuum floor / walls have different metrics.
Illustrative Example (Hypothetical Results)
Below is a stylized mini-case, just for illustration (not real data):
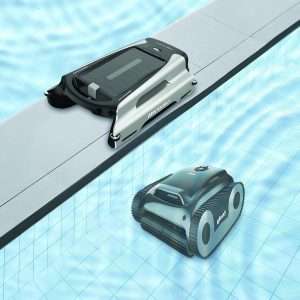
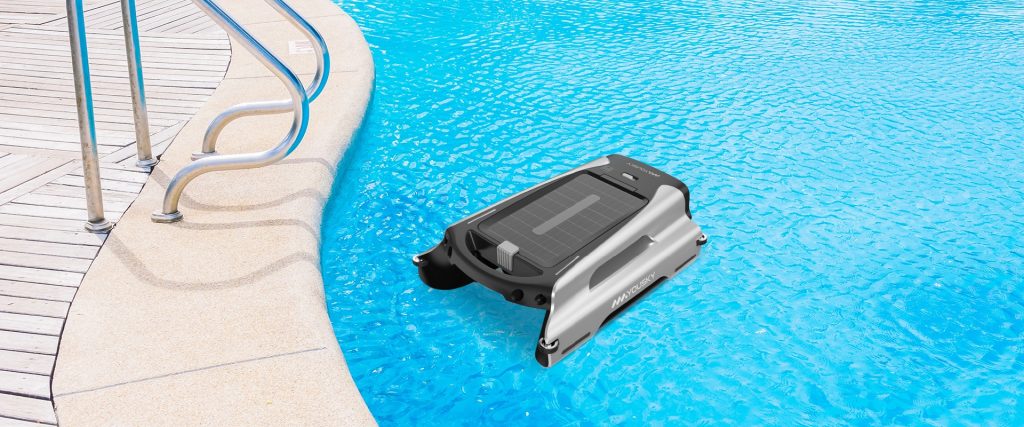
We tested two popular units: RoboSkim X (cordless solar-assist) and WaveFloat Pro (tethered, mains-powered).
- In the baseline test (200 leaves + 100 g dust), RoboSkim X removed 95% of the leaves and 80% of the dust in 30 minutes, with an energy factor of 0.6 Wh/m².
- WaveFloat Pro removed 99% of leaves and 92% of dust in 28 minutes, consuming 0.9 Wh/m² (higher power draw).
- However, WaveFloat struggled in one corner zone (missed ~10 leaves in corner) while RoboSkim, by virtue of a randomized path, picked up at least 8 of those.
- In obstacle test (floating mini net in path), RoboSkim detected and reversed successfully, while WaveFloat often looped three times before freeing itself.
- User ease: RoboSkim’s filter basket was top-loading and snapped out in 3 seconds; WaveFloat had a clamshell bottom that required submerging and twisting.
Conclusion: WaveFloat’s higher suction gives it slight edge in throughput and coverage, but RoboSkim’s lower energy use, better corner reach, and easier maintenance make it a strong all-around choice for moderate debris loads.
Such illustrative narrative, paired with quantitative charts and real photos, helps readers understand not just “which is best” but why.
Final Thoughts & Tips for Readers
- When comparing advertised specs, always check real-world test data: battery runtime, coverage, edge performance, and fault rates matter more than claimed suction.
- A robot that misses corners or repeats paths excessively may leave your pool surface unsightly despite good theoretical throughput.
- Maintenance burden (filter cleaning, fault recovery) is a significant usability factor over time.
- For buyers, match robot characteristics to your pool’s conditions: heavy leaf fall, windy location, irregular shape, etc.
- Over time, re-run performance tests (say after 50+ cycles) to see if performance degrades due to wear, debris abrasion, or fouling.